

What is machine learning in simple terms?
Machine learning in simple terms is a way of creating a model out of data and using this model to either gain insights from patterns in the data or predict values using the model.
The data must be in numeric form and the model is created using desired outputs called labels in supervised machine learning, or the relationship between types of data in unsupervised machine learning.
If the output is a type of measurement then it is called regression, whereas if the output is in types of groups then it is classification. For example, if the output is an amount between 0 and 1 it is regression, or if the output is either yes or no it is classification.
So, machine learning in layman terms is a way of taking a lot of numbers that are related in some way and finding useful patterns in them.
Student scores could be classification if classed as a grade like A, B, or C, or regression, if given as a percentage, such as 80%, 75% or 49%.
Types of machine learning
There is supervised learning, unsupervised learning and also reinforcement learning.
We can put in data to a model and it can learn to group the data, this is called clustering. As there is no label this is called unsupervised learning.
In supervised learning, a label could be the correct digit when we are giving a model different examples of numbers and wish the model to learn how to recognize which digit it is. This could also apply to facial recognition, or recognizing different types of objects.
Finally, reinforcement learning starts like unsupervised learning with no answers, but the predictions are reinforced when they are confirmed as either correct or incorrect.
This type of learning works when we don’t know all the labels, or we gain the labels over time. So reinforcement learning uses feedback to reward correct predictions thus learning over time.
Training data with the answers, called labels, is used with supervised learning, as opposed to clustering, a type of unsupervised learning that groups similar items, that has no labels.
Why do machine learning?
Lets imagine we have an important task. We need more sales and want to be careful with our budget. How do we increase our sales through advertising for example?
WE might start of doing market research and attempt to find out what our target customers want in a survey. This is collecting data.
Then, using this data, we decide what information we can get from this data to help us decide our approach to marketing. This is gaining insight from the data.
We then can make forecasts and decide how much we wish to spend on our marketing campaign, and forecast the increase in sales that is out goal.
Before we would have to create our own programs and write the code to make these insights into the data, and when it is finished this work is effectively useless as it could not be applied on another problem.
Machine learning can take the data and ‘learn’ how to find the insights in the data, and then be applied for other problems, either with the same data, added data, or completely new data.
We can give to desired output to a machine learning algorithm and it will learn the journey from the input data to the desired output and create a model. We can then use this model to either gain insights or even make predictions.
Example of machine learning
For example, image recognition. We could try to code a system to recognize all the features within images but this would be very difficult. New images that did not suit the rules would make the system useless.
We can train a machine learning model with a huge amount of images and the type of image for each one. The more images the better the model.
We could train a model to recognize cats or dogs, types of cars, even people’s faces. The model can be used for an extensive amount of different uses.
In summary, the machine learning algorithm can learn features from images taken as input and relate them to the output class of object (e.g. cat or dog). This model can then be given an image and predict the output (e.g. is it an image of a dog or cat).
Numeric Input
But images are not numbers, and we said it must have numerical input? Well images are numbers online or to a computer.
We create digital images with the codes for red, green and blue (RGB), or another such coding scheme, for each dot, called a pixel, and the image consists of thousands of these pixels. The more pixels the better the quality or resolution.
In image recognition we can use these numeric values as input so the system can decide what features it uses inside the image to recognize the object given as the correct input.
In the case of cats and dogs, there are features of cats and dogs that are different, a human can look at either and know what type if animal class it is, either a dog or a cat. The machine learning model, trained with many images, also can classify the image as containing a cat or dog.
Machine Learning is better
Manually dealing with large quantities of data is difficult, for us, but not for machine learning. We are increasingly using large quantities of data, such as big data, to find insights.
We have complex needs and the more data the more complex our needs become. Imagine trying to enter all the rules of driving for a driver less car, or making sense of all the sensor data for a flying airplane.
Not only are our needs complex, deal with a huge quantity of data, and require speed in some cases, but also the data is changing.
We need to be able to adapt to our new challenges. Our program must deal with ever changing data, new data, altered data, new types of data, and new requirements and needs.
Humans can not code fast enough to meet the demands that we can with machine learning.

There is an accompanied video series on machine learning using orange. If you are interesting in these videos please click this link – machine learning using orange
Machine learning algorithms in simple terms
Machine learning is based on the data, but there is a set of machine learning algorithms that are commonly used for the range of tasks performed on this data.
Below we give a brief introduction to the popular approaches to machine learning. The focus is to provide a simple to understand introduction to machine learning concepts rather than an exhaustive list of details.
Further details are provided in other articles for some of these machine learning algorithms where a link is provided.
Linear Regression
Simple linear regression in simple terms is taking a set of data points and producing the line of best fit that represents the relationship between two variables x and y.
The greater the relationship, or correlation, between the variables the better this regression line can be used to predict values (e.g. of the y variable or dependent variable) given a value for the other variable (the independent variable x).
The statistics relevant for linear regression include the basic slope and constant of the line called the coefficient for the slope and the [y] intercept for the constant.
An additional e value representing the possible error is also sometimes added to the equation of the regression line.
For a full introduction to linear regression please see the article “linear regression in simple terms”
Linear Regression Example in Orange
If you would like to watch video tutorials of machine learning using orange then visit this link – introduction to analysis using orange.
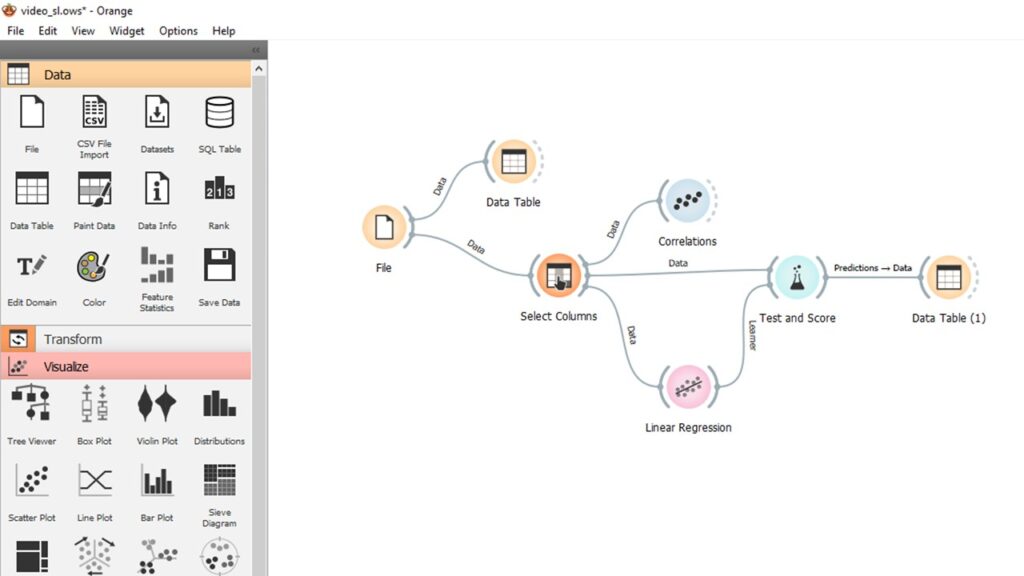
Using orange is a simple introduction to machine learning. We start with linear regression and the following example.
We stat by uploading the data using file, the data is available for download, it is called data.csv.
We can see the data using the data table widget. In this example we are using data about cars, with the weight and volume available as features, and the volume used initially.
In the above diagram the correlation widget shows a Pearson correlation of +0.592. The default settings are left for both the linear regression and test & score widgets, although it is vita that the option ‘test on train data’ is selected.
The results are given in a final data table. The column labelled linear regression shows the estimates of CO2 output using the volume feature for the data items.
As linear regression is supervised the labels for CO2 are the target variables and also seen in the data table below.

If you would like to watch video tutorials of machine learning including supervised learning using orange then visit this link – Supervised Learning – Analysis using Orange
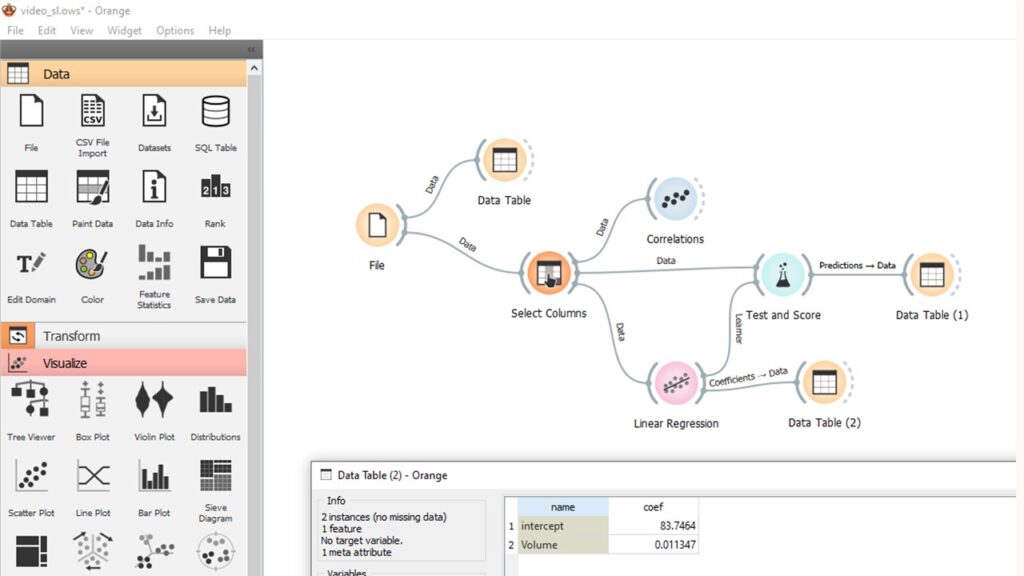
The primary statistics for linear regression are the slope, called the coefficient, and the y-intercept, or just intercept. In orange we can add a data table to the linear regression widget to see these figures.
We can see the intercept is 83.7464 and the coefficient is 0.011347.
We can add other features, such as the weight in this example, to move from simple linear regression to multiple or multivariate linear regression.
Linear Regression with Test Data in Orange
Finally, we can predict new test data using the prediction widget in orange.
We have the same example using the data seen in the above example and the linear regression model is once again used learning from the training data.
But in this instance we use a separate file with additional data, which is the test data.
The test data used in the linear regression was data_test.csv.

If you would like to watch the video tutorial of linear regression using orange then visit this link – Linear Regression Evaluation – Analysis Using Orange
Logistic Regression
Logistic regression in simple terms is a machine learning approach that classifies data into classes using the line of best fit, or regression line, to identify the boundary between the classes.
In its simplest form data in one class occurs on one side of the regression line and data in another class occurs on the other side of the line.
The class of new data points are predicted based on the side of the regression line that they fall.
Data used in the logistic regression was tumor.csv.
Support Vector Machines (SVM)
Support vector machines in simple terms are a classification approach based on the best fit line between two classes of data points created using the nearest points, called support vectors.
In contrast to linear regression this line is not used to give a prediction of the value of a variable or data point, but rather to classify a new data point into one of the two classes.
For a full introduction to linear regression please see the article “support vector machines in simple terms”
In the support vector machine examples the second data set was iris, which is available with orange using datasets. The first example used user_data.csv.
K Nearest Neighbors (KNN or K-NN)
K nearest neighbors in simple terms is a machine learning approach that classifies a data point into the class of the nearest neighbor (1), or neighbors (k).
The amount of data points used for the classification is predefined, called k, and then a majority vote of these data points determines the label of the class for the new data point.
For example, we have three classes of mild, acute, and severe with data points labelled in these classes. We wish to classify a new observation and decide to use K-NN with k equal to 11.
In this example there are 6 acute, 4 severe and 1 mild data points in the 11 closest points, or nearest neighbors, thus we classify the new data point in the acute category.
In the example of k-nearest neighbor using orange the data used was example.csv.
Machine learning concepts in simple terms
There are many concepts relating to different machine learning approaches, how algorithms and models perform and are evaluated, and vocabulary specific to machine learning.
The following list attempt to give simple explanations of machine learning concepts in simple words.
Machine Learning
A subarea of Artificial Intelligence that uses a set of algorithms to make predictions by learning from examples. Although it is the data that guides the computer to the prediction rather than the algorithm.
Supervised Learning
A model is created by learning from examples that are labelled with the correct answer for that data set. By learning how the variables, also called features, relate to this label, the model can then make a prediction for a new case.
Unsupervised Learning
A model uses the data to identify patterns such as similarities between examples and uses this to group items in clustering for example.
Classification
A form of supervised learning where the required prediction is a discrete value, called a class. For example, the prediction is either true or false, positive or negative, or one of a selection of categories like A, B, C or D.
Regression
A form of supervised learning where the required prediction is a continuous value, such as how much or how many. Examples include a price, percentage, or measurement.
Overfitting
Overfitting in simple terms is when the machine learning model fits the training data too well and results in poor performance when applied on other data such as the test data.
Bias
The bias in simple terms is the bias of an algorithm to a set of data such as when producing a line of best fit that is great for the training data but does not do well on the test data for example.
When we use machine learning and the model produces large differences between the line of best fit and the observed data it is said to have high bias.
When the line of best fit is very close to the data points, such as when overfitting occurs, then it has low bias.
Variance
Variance in simple terms is the amount the machine learning model can vary from the test data of different data sets.
When overfitting occurs, the algorithm does not give a general prediction of data therefore future test data can be of high variance as it differs from the original training data.
Low variance occurs when a good machine learning model represents data sets very well and there is little difference between the predictions and the data points.
Material to be added
We will update this article with the additional information requested. The decision tree video also used the weather.csv data file.