
What is big data in simple terms?
Big data in simple terms is data that is too large or too complex to be handled by traditional data management tools like databases.
Big data includes data that is not structured like the data in a database. This includes data in a semi-structured format like in a form with fields and labels, or unstructured data such as images, videos, audio and free text.
Big data is so popular because of the the availability of large storage capacity, the production of large quantities of data and the ability to apply techniques to analyze large quantities of data.
Although statistical techniques applied on data are not new, the availability of insight into data for business purposes has increased data analysis.
Big data in simple terms has risen because companies produce and analyze data to improve their sales, get insight into customer’s preferences, and make their operations more efficient.
The internet has largely contributed to the production of valuable data with social media alone producing millions of texts that potentially contain information that a company can use to understand how their customers feel about a product for example.
Source of big data
Organizations have always produced data that they store and query, but where does this new data come from?
We have data from people such as on social media mentioned previously, from devices such as phones and software such as health monitoring apps.
Businesses are also collecting and storing more data about clients, business processes, transactions and many more areas, in the assumption that this data could be useful.
Because of this desire to create and store large quantities of data, we see the application of big data on only a small amount of data that is collected, with considerably more than half of all data produced is never used.
Importance of big data
The importance of big data is such that it is considered a driving force for economic growth. It is important not only at the organizational level but also nationally.
As consumers we are increasingly reliant and expectant on personalized information in the form of suggested videos, movies and TV programs, to products and services. Even expecting localized adverts when appropriate.
Companies are structuring to accommodate enterprise wide information systems so they can maximize the benefit of data analysis.
But it goes further, the use of big data analytics is helping the health industry, science and research and even ventures into space.
Big data challenges
With success comes expectation and advancement. Historically data analysis collected and prepared data and then applied techniques to gain information.
But now the analysis must go to the data. Even a large airplane uses data during the flight, this type of data is known as real-time data.
The capture of data from sensors and equipment can provide both structured and semi-structured data but there are more complex needs.
The analysis of big data includes images and video, such as for an x-ray or a driver less car. The complexity and the reliability of the data make the process of storing and analyzing data to gain insight more difficult.
Big data storage
Data beyond the traditional database requires a simplified approach to storage with less metadata such as table formatting like columns and rows.
As SQL is the standard language to process database data the approach to accessing non-database data, such as in JSON and XML, is know as noSQL (not-only sql).
XML is a markup language similar to html that we use for web pages but instead of telling the computer how to present the data, it tells the computer what is the data. So, for example, instead of having a paragraph tag around a person’s name, it has a tag called name.
JSON is a form of semi-structured data where the data has a label. This is similar to the format of a dictionary in python, called an associative array in other programming languages like perl.
Data is stored with only a basic index system used for retrieval. No details about the data are stored and it is therefore not appropriate for data queries.
Big data is treated as a large quantity of data that is uploaded or imported into a form, such as a csv (comma separated value) file, to be analyzed together.
Finally, we are increasingly using cloud technology to store our data. Departments in an organization kept their own data, but this is problematic when a company wants to analyze all the data across the departments.
Information systems require the data to be easily accessible and cloud storage makes this simple.
In 2001 Gartner defined big data in three parts, with the first part producing words describing big data beginning with the letter ‘v’. The original definition was:
“Big data is high-volume, -velocity and -variety information assets that demand cost-effective, innovative forms of information processing for enhanced insight and decision making.“
In subsequent references people started to quote the 3 V’s of big data as volume, velocity and variety. The explanation of these are to follow below.
Perhaps the most important ‘v’ is value and this is commonly added to form an additional ‘v’ of big data. Here starts the confusion. The most used graphic (seen below) does not include value in the four.

In this popular image the four V’s of big data are volume, variety, velocity and veracity. Therefore, we have the original three V’s and the inclusion of veracity, although we do not have the most important v of value, so do we now have 3, 4 or 5 V’s of big data?

Additional V's of big data
We now have some sources using 3, 4 or 5 V’s of big data using the original volume, velocity and variety, and the additional veracity and value. This is where it starts to get even more complicated!

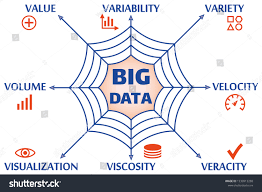
The next level of 8 V’s of big data is seen in new images and definitions of big data (see image above). Common additional terms include visualization, viscosity and virality. In the diagram below we see the 9 V’s of big data with the ninth v of variability.
How many V's of big data?
There have been an ever increasing amount of v’s of big data so it is difficult to state the correct amount of v’s should be used in the definition of big data.
We can say the original three of volume, variety and velocity are a start, whilst value is perhaps the most important and therefore should also be included.
If the data is incorrect it is also of no use, therefore the correctness and quality of the data is also of concern. It could be argued that if the data is of value it can be used and if it is not of value it is not of use.
Can incorrect value be of use? Do we need to add veracity?
The concept of identifying the correctness and quality of data is increasingly important as the storage and management of too much irrelevant data is damaging to the process of locating and using the valuable data.
The additional v’s of visualization, viscosity and virality and even variability, are aspects of big data, but are they essential elements to the definition of big data?
So, in summary, there are 5 V’s of big data with the inclusion of veracity, although it could be argued that the 4 V’s of big data of volume, variety, velocity and value are sufficient for the definition of big data.
What are the V's of big data?
Volume
Data storage and processing are now cheaper therefore it is viable to find valuable information inside large quantities of data to produce more accurate and precise business decisions.
Variety
Variety refers to different types of data that are available such as the traditional organizational data of transactions and reports, social media and other online data, and the data held in audio, visual and video format.
Velocity
The speed of data generation and production has increased to a high velocity to meet demands.
Value
Value is perhaps the most important v in the definition of big data as the data is of no use if it has no value. It is not about how much data you can use, but having the right data that provides value.
Veracity
Veracity refers to how confidence are we the data is at an acceptable level of quality. If there is uncertainty about the quality of the data and its availability then is it of value?
Variability
Data is inconsistent. Data collection produces data items that can include errors, outliers, missing data, data of different structure and type, out-of date and irrelevant data.
This variability in the data causes issues in the management of the data. The majority of big data (over 50%) must be prepared before it can be used.
Validity
Veracity concerns quality, validity is concerned with authenticity. The data must be authentic, correct and accurate.
Volatility, Visualization and Viscosity
Volatility is a measure of the duration the data is of use for analysis.
A common task in data analysis is to grasp a general understanding of the data, this is often achieved through data visualization.
Viscosity refers to the issue of flow, or resistance to the flow of data.
Other V's of Big Data
Other words included in the list of words associated with big data include virality, how fast is data communicated over networks, vagueness, venue and vocabulary. In addition, there are the ‘new’ 3 V’s of big data that are verbosity, voluntariness and versatility.
The issue of too much data, or specifically too much irrelevant data, has become a problem with information extraction from document and web text. If big data is ‘verbose’ it will also encounter these issues.
Despite the demands, data is generated and valued by many organizations with an increasing amount of versatility in its use. There is a wide and diverse range of industries that benefit from big data analysis.
The fact that big data is available to so many areas illustrates its voluntariness. Venue relates to the different platforms used with big data, the collection of data terms is vocabulary, whilst the lack of clarity of meaning of some data is vagueness.
Types of Big Data
We associate big data with the volume of data but the variety of data is of equal importance. This variety is seen in the data structure. For day to day data needs systems use structure to manage data, but now we have extended our data needs.
There are three types of big data : structured data, semi-structured data, and unstructured data.
Structured Data
Traditional methods to store and access digital data rely on the ability to select any data item or collections of these data items easily though its structure. Numerical data is found in spreadsheets, but we use primarily use databases.
Databases store data using metadata to describe and access the data using a tabular format of columns and rows for the attributes of the data for each record.
We use SQL to both store the data (data definition language) and access and manipulate the data (data manipulation language) extensively over all commercial database systems.
For an organization its data is important and database systems are populated with structured data. Although SQL is a primary skill for data analysts, big data goes behold traditional databases.
Many organizations have access to large quantities of data both interanlly and externally.
Semi-structured Data
There is a large amount of information in web pages, documents, forms, emails and social media that is not suitable for database storage classified as semi-structured data.
There can be an underlying structure in the data, many web pages contain data from databases, and forms, emails and other social media communications have a format such as labelled values.
To handle vast quantities of data without the extensive overhead of fast access and metadata, new methods of storing and accessing data items in a simple approach, use an index for retrieval.
Not only SQL (noSQL) systems store large quantities of semi-structured data such as twitter data. Although the system can’t access individual data items efficiently, it can access the data collectively which is suitable for data analysis of big data.
Unstructured Data
The category of unstructured data is used to group the data in a difficult form to gather and process. A system related to the forecast of weather could use images, photographs, local media, social media and textual information.
The task of integrating these different formats of data is problematic and a challenge to any system. Medical systems use x-ray images, geographical systems use maps, prediction systems may require social media as input, including photographic data.
To integrate all the potential data to gain insight requires dealing with data that is not ready for analysis and requires considerable attention to be prepared.
Given the increasing use of data for real-time analysis, the use of unstructured data is perhaps the biggest challenge to big data.
Big Data Professionals
Although there is much cross over between roles there are differences in jobs related to big data and data analytics.
We include the primary big data professionals, the positions, roles and skills that are common to the big data task. These include the data analyst, data engineer and data scientist.
Many tasks involve software engineers and possibly product managers or business analysts. There are associated data positions that are not within the scope of this simplified version.
Data Analyst
Analyze data to gain valuable information that can improve business decisions. Data analysts primarily focus on existing data to find patterns or trends.
This involves understanding the data, preparing and exploring it to find the valuable insight.
Data Scientist
Data scientists use data to solve business problems and are involved in all the processes from data collection to optimization and prediction rather than focused on one specific area.
Data Engineer
Data engineers build the systems that the other data professionals rely on to do their jobs. They are responsible for the network, hardware, software and system considerations required for collecting, storing, accessing and managing the data.
Machine Learning Engineer
Machine learning engineers create models from the data such that the models can be used for predictions and insight.There are many potential solutions from classifying or categorizing data to making predictions.
The task of applying machine learning algorithms to business problems requires knowledge of which approach should be taken to find the insights required.