

What is data analysis in simple terms?
Data analysis in simple terms is the application of a series of techniques to evaluate data.
In the analysis of data it is valuable to find patterns, relationships and trends that gain insight and potentially be used to improve decision making for example.
Data Analysis Process
We can describe the process of analyzing data from start to finish in stages. It is often described as the process of finding, collecting, cleaning, examining, and modeling data to get valuable information and insights.
It is more than collecting and looking at the data, so we can describe it in the following five stages:
- Identify the business question you want to answer
- Collect the raw data
- Clean and prepare the data ready for analysis
- Analyze the data to discover patterns, trends and information that could be useful to answer your business question
- Interpret the results of your analysis to see how the data answers your business question
Types of Data
There are several ways to describe data or categorize it by a characteristic, seen in statistics and research.
If we can apply a quantity on the data then it is quantitative data, such as the weight, length or cost.
The alternative to quantitative is qualitative data, which we do not have a quantity such as color.
Scale of measurements
There are four types of data in regard to the scale of measurement: ordinal, nominal, interval and ratio. These are explained as either categorical or continuous types of data.
Categorical Data
If we wish to put data into categories then it is categorical data. Categorical data is either ordinal or nominal.
If the data categories have some type of order then it is ordinal, such as first (1st), second (2nd) and third (3rd) in a race or competition.
If there is no order to the categories then the data is nominal. For example, in a survey a question asking if a person is married, single, divorced or widowed, would result in nominal data.
Continuous Data
When we take a measurement, such as height, weight, or length, we note the exact measure, such as with a real number. The measure could be 1, 2, 3 etc. or involve a fraction such as 6.5 or 8.1.
Ratio measurements can be zero and also can be measured against each other, such as ‘table a’ is half the length of ‘table b’, or, this packet is double the price of this packet.
The other continuous measurement is in an interval, such as the date or a temperature. We do not relate interval data such as it is double the temperature today, or, it is half the date. Interval data does not use a zero value as with ratio data.
Summary
- Nominal – categorical data that has order but is not continuous, like 1st, 2nd and 3rd, or disagree, agree, strongly degree
- Ordinal – data in categories with no order like yes or no, married, single, divorced, etc.
- Interval – continuous data with no zero and no half measures like time and temperature
- Ratio – continuous data that can have a half or zero measure. Includes length, height, weight and price.
Data Preparation
Once we have the data we can perform several operations to view the relevant data we need for further analysis. Included in these operations are the following:
- Filter: reduce the focus to a subsetion of the data
- Select: pick selected data items
- Mutate: generate new variables from on or more of the existing variables
- Summarize: calculate a summary of the data
- Arrange: sort into some order
Understanding Data
The easiest approach to understanding data is to view it in a visual format such as in a chart, graph or table.
To emphasize a point, to illustrate a fact or finding, or to give a simple overview of data, there are a wide range of charts and graphs to use.
Data Visualization
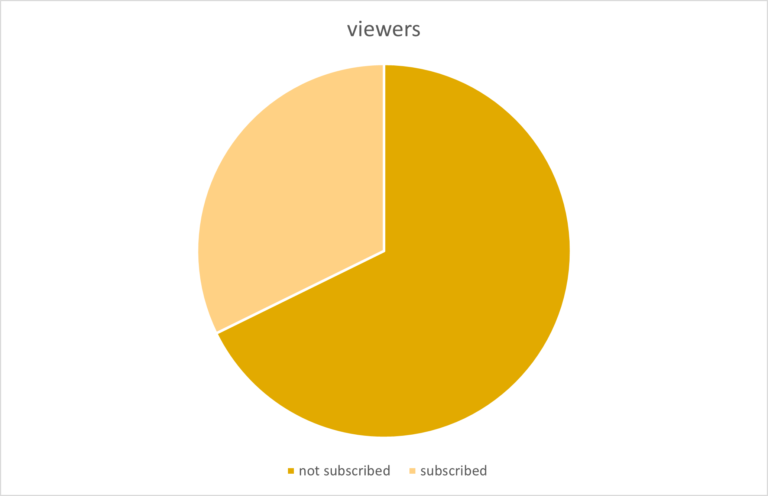
We use different types of charts or graphs depending on the type of data and the amount of variables. For example, if we have one variable, such as a binary answer (yes or no) we could use a bar chart or a pie chart.
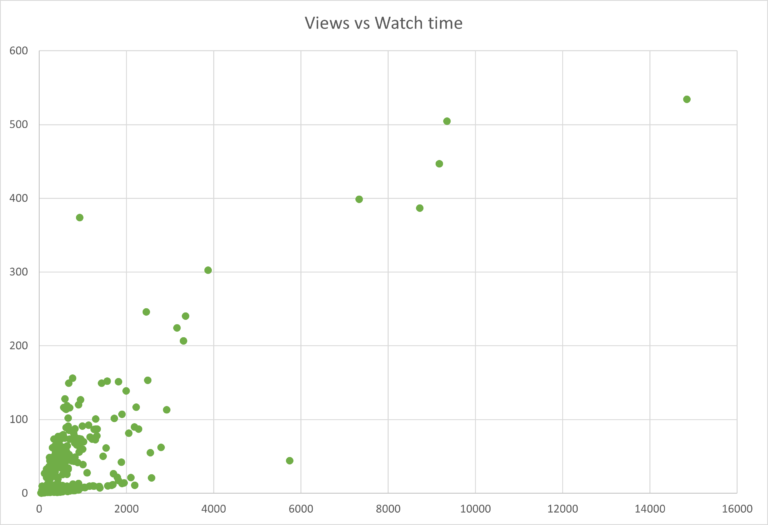
Alternatively, to compare two variables to see if there is a relationship between them, the degree of correlation, we would use a scatter plot. We could compare the height and weight of students in a class and hypothesize that there will be a relationship between them.
Charts
To understand data we use visualization to easily convey meaning and give the viewer an easy-to-understanding of a summary of the data.
We choose the appropriate chart to emphasize an aspect of the data and to match the type of data that it shows. For example, a pie chart shows the percentage of two or more variables.
Other charts using the same data may emphasize your main observation better, or just be more visually appealing.
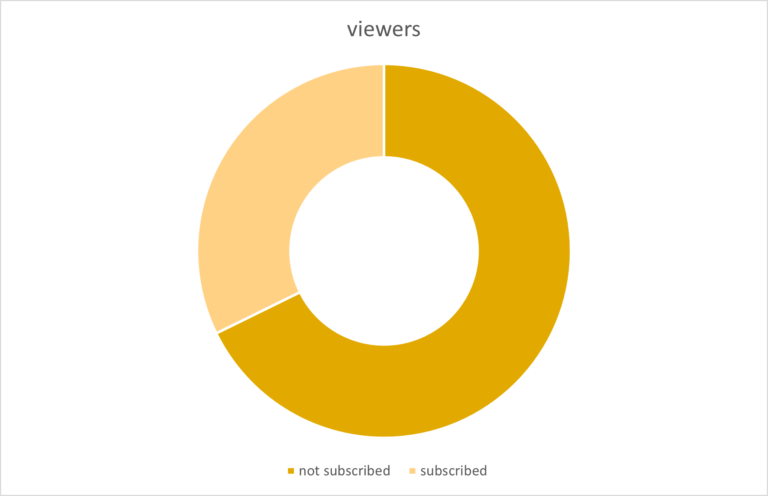
A donut chart is very similar to a pie chart. If the numerical values are important then they can be added, or, a bar chart can be used as it has values listed on the y-axis.
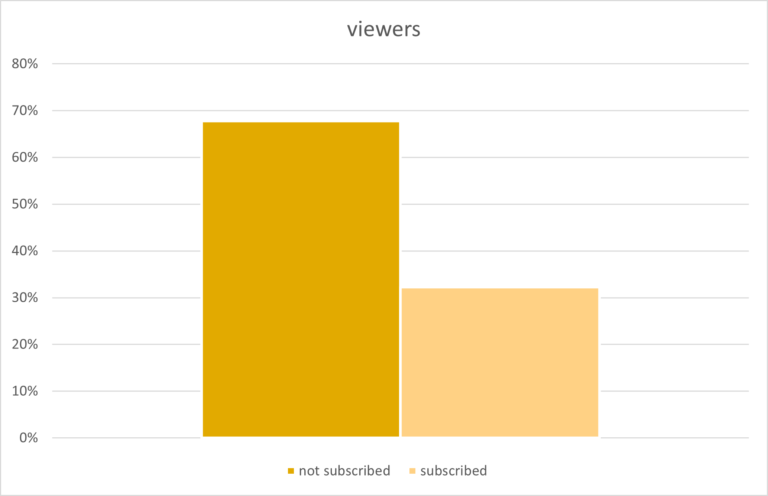
There are many types of charts and the best chart to choose will depend on your data.
Most data will not be visually perfect and charts will often not look like the examples given in book, courses and online. Nevertheless we can still get an overview of the data.
Scatter diagrams are good for comparing two variables to see if there is a relationaship. Although most examples are grouped together, we can see in the above diagram that the increase in views also results in the increase in watch time. This is said to have a positive correlation.
In the next example the data is predominantly in two categories and skewed to the early values. This is the perfect opportunity to use a funnel chart, which is rare with most data.
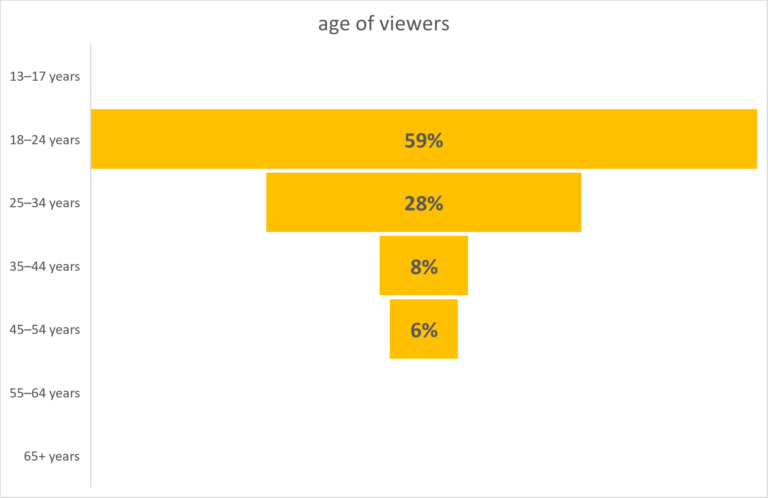
In this example that displays views in age brackets, the values are added clearly. The funnel shows how the views are predominately in the 18-24 age group, then 25-34 age group and so on.
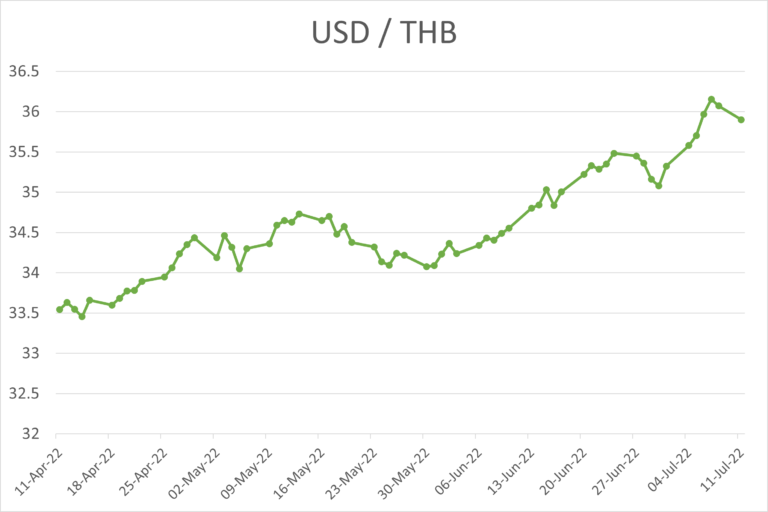
Data over time is represented well in a line chart where it is easy to see the trends.
In this example it is easy to see the trend is rising which means the amount of Thai baht per US dollar has risen over the last 3 months.