
Home > confusion matrix
What does a confusion matrix tell you?
A confusion matrix can tell you how good your predictions are compared to actual results. In machine learning terms, it shows how your model performs when making predictions.
This article includes:
- what is a confusion matrix?
- why use a confusion matrix?
- what are true positives (TP), false positives (FP), true negatives (FP), and false negatives (FN)?
- create a confusion matrix
- confusion matrix example – covid
- confusion matrix example – ball
- confusion matrix for multiple classes
- confusion matrix practice exercises
- confusion matrix terms
- confusion matrix faq
- confusion matrix practice solutions
What is a Confusion Matrix?
A confusion matrix is a grid that contains four metrics that combine true predictions that are correct, with false predictions that are incorrect, for binary classifications such as yes or no, positive or negative, or 0 or 1.
A confusion matrix can also be used to calculate performance metrics such as accuracy, precision, recall and F1 score, which equally combines precision and recall measures.
These metrics are used to evaluate the performance of machine learning models for example.
In supervised learning a machine learning algorithm uses data examples that have a label to train a model. The label is the correct answer that the model should give with that data.
To understand the strengths and weaknesses of a model, and see how it is performing, a confusion matrix can show how the predictions compare to the actual results, the given label.

An accompanied video series on machine learning using orange includes a video on the confusion matrix. If you are interesting in this video please click this link – confusion matrix in orange.
What is Binary Classification?
A confusion matrix shows the performance for binary classifications meaning something that has one of two results, these are given the outcomes of positive or negative.
An example in healthcare would be a test to indicate if a patient was suffering from an illness (e.g. covid). A positive test result would indicate the patient has the illness and a negative test result would indicate they do not.
When there are more than two outcomes then a multiple class confusion matrix can be used. Details, explanations, images and examples of both binary and multiple class confusion matrices are given below.
What is a Dataset?
A dataset is a set of records, examples or cases that act as a test set. For each instance in the set there are a collections of details, called features, and a label.
Why use a Confusion Matrix?
We consider a yes / no question as having either of two answers but predictions need more information.
We make predictions for prices in a stock market or if it will rain. But we could say it will rain every day and we would statistically be 100% correct on days that it does rain. But what about the days that it does not rain?
So to evaluate predictions we need to see when a positive prediction (e.g. rain) is correct or wrong, and, when a negative prediction (e.g. no rain) is correct or wrong.
A confusion matrix has four metrics: true positives, false positives, true negatives and false negatives.
What are True Positives, False Positives, True Negatives and False Negatives?
A confusion matrix always consists of four elements:
- True Positive (TP) a correct positive test
- True Negative (TN) a correct negative test
- False Positive (FP) an incorrect positive test
- False Negative (FN) an incorrect negative test
A false positive is also known as a type I error, and a false negative is also called a type II error.
In the example of a covid test, a positive test indicates the patient has covid, a negative test indicates that the patient does not have covid.
In a confusion matrix example evaluating a covid test the four confusion metrics have the following meanings:
- True Positive (TP) – the patient has covid, test correct.
- True Negative (TN) – the patient does not have covid, test correct.
- False Positive (FP) – the patient does not have covid despite the test indicating that they do have covid.
- False Negative (FN) – the patient has covid, but the test incorrectly indicates that they don’t have covid.
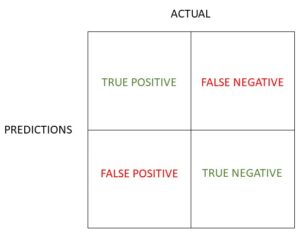
Create a Confusion Matrix
To create a confusion matrix draw a 2 by 2 grid. A simple confusion matrix has the predictions horizontally and the actual results vertically, such as in the following diagram.

There are alternative formats (see below), but the simple confusion matrix is a four cell grid and these four cells contain the four metrics of true positives, false positives, true negatives and false negatives.
Confusion Matrix formats
To clarify that there are different formats for the confusion matrix but they are all the same. They contain the same metrics.
Be careful when using a confusion matrix with a different format as the false positive and false negatives are placed differently.
Another alternative format for a confusion matrix uses the 0 and 1 digits to indicate negative and positive (see below). Once again the metrics are the same but the placement is different.

In summary, there are several ways to show the four metrics in a confusion matrix, but they are all the same.
Mak sure you understand which metric is in which grid cell before you use the figures to calculate the performance statistics that we will now explain.
Confusion Matrix example
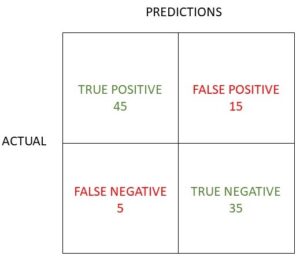
Here is a covid test example written like an exam question:
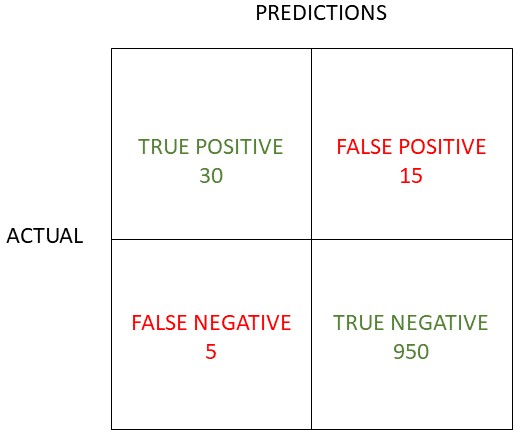
In a Covid test of 1000 patients, there were 45 positive tests, of which 30 patients had covid and 15 were falsely tested positive.
Of the 955 negative tests there were 5 that were incorrect, these patients had covid but were tested negatively.
Draw the confusion matrix and calculate the accuracy, precision, recall, sensitivity and F1 score from the matrix.
The confusion matrix evaluation metrics will be explained in the next section, but lets first focus on the confusion matrix. Remember a confusion matrix always consists of four elements:
- True Positive (TP) a correct positive test – 30
- True Negative (TN) a correct negative test – 950
- False Positive (FP) an incorrect positive test – 15
- False Negative (FN) an incorrect negative test – 5
The total of 1000 cases consist of 45 positive tests (TP + FP) which are correct (30) and incorrect (15). The other 955 negative cases (FP + FN) contain 5 incorrect tests and 950 correct tests.
We enter these in our confusion matrix as seen below.
The simple approach to answer our example question would be to plug each value into the formulas to get the results.
Confusion Matrix Evaluation Metrics
The covid test example question requires the accuracy, precision, recall, sensitivity and F1 score from the confusion matrix. So how do we get these?
We will give explanations of these evaluation metrics, but to simply answer the question the numbers from our confusion matrix above can be entered into the following equations.
Evaluation Metric Equations
Confusion matrix evaluation metrics including accuracy, precision, recall, sensitivity and F1 score are seen in the following equations:

- Accuracy – the percentage of correct predictions.
- Precision– the percentage of positive, correct predictions
- Recall– the percentage of actual cases that the test has correctly identified.
- Sensitivity– the same as recall
- F1 score – a measure that equally combines both precision and recall
In this example, the covid tests would consist of the following evaluation measures:
- Accuracy – the percentage of correct predictions, covid or no covid.
- Precision– the percentage of tests testing positive that were correct from all the positive predictions.
- Recall– the percentage of covid sufferers that were correctly identified by the positive result.
Confusion Matrix Evaluation - Covid example
We have the metrics from the confusion matrix and the evaluation equations, therefore we can easily calculate the requirements from our original question.
- True Positive (TP) a correct positive test – 30
- True Negative (TN) a correct negative test – 950
- False Positive (FP) an incorrect positive test – 15
- False Negative (FN) an incorrect negative test – 5

Calculate the accuracy, precision, recall, sensitivity and F1 score from the matrix.
Accuracy
- number of correct predictions / total number of predictions
- 30+950 / 30 + 15+ 950 + 5
- = 980/1000
- = 49/50 or 98%
Precision
- true positive / true positive + false positive
- 30 / 30+15
- =30/45
- =2/3 or 66.7%
Recall (and sensitivity)
- true positive / true positive + false negative
- 30 / 30+5
- =30/35
- = 0.857 or 85.7%
F1 score
- 2 x (precision*recall / precision + recall)
- = 2 * (0.57/1.52)
- = 2*0.375
- =0.75 or 75%
Confusion Matrix Evaluation - ball example
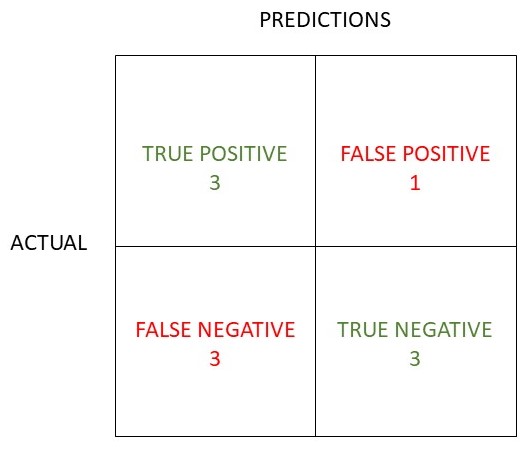
Imagine we are playing a game where you have to guess if the next item is a ball or not. You are aware it happens around half the time.
You make a guess, the item is a ball or nor a ball, and you are awarded one or zero points. Here is an example dataset of results of 10 guesses, the correct answers and points awarded.
- item = ball, correct guess, 1 pt
- item = ball, incorrect guess, 0 pts
- item = no ball, correct guess, 1 pt
- item = ball, correct guess, 1 pt
- item = no ball, incorrect guess, 0 pts
- item = no ball, incorrect guess, 0 pts
- item = no ball, correct guess, 1 pt
- item = no ball, incorrect guess, 0 pts
- item = ball, correct guess, 1 pt
- item = no ball, correct guess, 1 pt
The prediction ball was made 4 times and it was correct 3 out of those 4 times. The prediction no ball was made 6 times, with 3 out of those 6 attempts correct.
Here is the resulting confusion matrix:
Calculate the accuracy, precision, recall, sensitivity and F1 score from the matrix.
Accuracy
- number of correct predictions / total number of predictions
- 6/10 or 60%
Precision
- true positive / true positive + false positive
- 3/4 or 75%
Recall
- true positive / true positive + false negative
- 3/6 or 50%
F1 score
- 2 x (precision*recall / precision + recall)
- = 2* (0.75*0.5) / 1.25
- = 2* (0.375/1.25)
- = 2* 0.3
- = 0.6 or 60%
Sensitivity is the same as recall.
Confusion Matrix for Multiple Classes
A confusion matrix with multiple classes has more than two outcomes such as group A, B, C or group D, or, single, married, divorced, or widowed for example
The matrix is similar as with binary class examples although there the only format requirement is that the grid is of equal size both horizontally and vertically (3 by , 4 by 4, etc.).
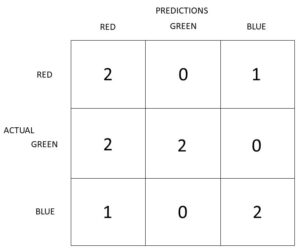
Multiple Class Confusion Matrix example
Similar to the binary classification example of predicting a ball, in the multiple class example we have a selection of three colours, red, green and blue.
Predicting the colour of the next ball we have the example results as follows:
- colour = green, guess=green 1 pt
- colour = blue, guess=red 0 pts
- colour = blue, guess=blue 1 pt
- colour = green, guess=red 0 pts
- colour = red, guess=red 1 pt
- colour = green, guess=green 1 pt
- colour = red, guess=blue 0 pts
- colour = red, guess=red 1 pt
- colour = blue, guess=blue 1 pt
- colour = green, guess=red 0 pts
The confusion matrix for the multiple classes is 3 by 3 grid.
Confusion Matrix in orange
The confusion matrix seen in orange is formatted slightly differently with added colouring and the row and column totals also given.
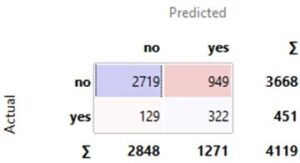
We can calculate the evaluation metrics from this confusion matrix in the same way as in the previous examples.
Accuracy
- number of correct predictions / total number of predictions
- 3041/4119 = 73.8%
Precision
- true positive / true positive + false positive
- 2719/3668 or 74.1%
Recall
- true positive / true positive + false negative
- 2719/2848 or 95.5%
F1 score
- 2 x (precision*recall / precision + recall)
- 2* (0.7077/1.696)
- 0.835 or 83.46%
Sensitivity is the same as recall.
Practice Exercises
Stage 1. Create the confusion matrices for the following exercises. The solutions will be given at the end of the article.
Step 2. Calculate the accuracy, precision, recall, sensitivity and F1 score from the confusion matrices from part 1. Again, the solutions will be given at the end of the article.
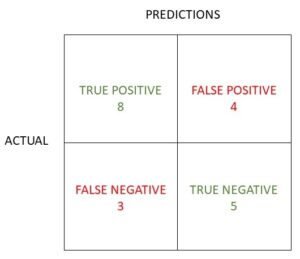
Exercise 1 - 20 cases
In exercise 1 there are only 20 cases where 8 patients are diagnoses correctly as positive and 4 incorrectly.
There were 8 patients diagnoses with a negative result, 5 correctly and 3 incorrectly.
Complete the confusion matrix first, check it again the solution given below, and the calculate the evaluation metrics.
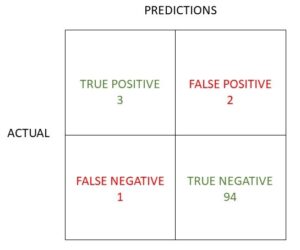
Exercise 2 - 100 cass
In exercise 2 there are 100 cases where only 5 positive cases were found, and there was only one case that was incorrectly negative.
Of the five positive cases, the actual results showed 3 correct and 2 incorrect cases.
Exercise 3 - 100 samples
In exercise 3 there are also 100 samples. Of the 60 positive samples there were 45 correctly identified positive cases, whilst there were also 35 correctly identified negative cases.
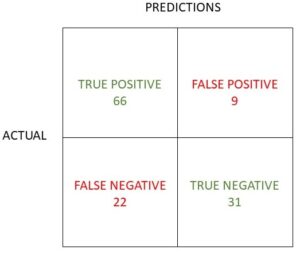
Exercise 4 - 128 tests
In exercise 4, of the 75 positive tests, 9 were false, whilst the 53 negative tests included 22 that were false.
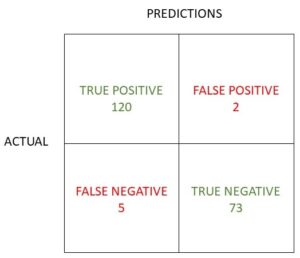
Exercise 5 - 200 tests
In exercise 5, of the 122 positive tests, only 2 were false, whilst the 78 negative tests included only 5 that were false.
Good luck with all the exercises. scroll down to see the solutions. The confusion matrices are given first, and the other evaluation metrics are given after.
Terms
Confusion Matrix
A confusion matrix is a grid that contains four metrics that combine true predictions that are correct, with false predictions that are incorrect, for binary classifications such as yes or no, positive or negative, or 0 or 1.
Binary Classification
A binary classification classes the result into one of two results,such as positive or negative
True Positive (TP)
True Positive (TP) a correct positive test
True Negative (TN)
True Negative (TN) a correct negative test
False Positive (FP)
False Positive (FP) an incorrect positive test
False Negative (FN)
False Negative (FN) an incorrect negative test
Multiple Class Confusion Matrix
A confusion matrix with multiple classes has more than two outcomes such as group A, B, C or group D, or, single, married, divorced, or widowed for example
FAQ
Here are some short answers to popular or frequently asked questions:
What is the advantage of confusion matrix?
The advantage of a confusion matrix is it is a visual tool that can show the performance of a model in a simple and effective way.
What is a binary confusion matrix?
A binary confusion matrix is a grid that contains four metrics that combine true predictions that are correct, with false predictions that are incorrect, for binary classifications such as yes or no, positive or negative, or 0 or 1.
How does confusion matrix work?
A confusion matrix simply takes the figures for the positive and negative results of a test and shows how many of these are correct and incorrect.
What are confusion matrix metrics?
- True Positive (TP) a correct positive test
- True Negative (TN) a correct negative test
- False Positive (FP) an incorrect positive test
- False Negative (FN) an incorrect negative test
What is a 3x3 confusion matrix?
A3x3 confusion matrix is a type of multiple class matrix that has nine cells, three columns by three rows. This indicates there are three classes such as red, green and blue in the example above.
What is confusion matrix with example?
The explanation and examples of a confusin matrix are in the article above.
How do you write a confusion matrix?
Although there are several ways to format a confusion matrix the standard way to write a confusion matrix is as follows:

Practice Solutions
The practice exercise solutions start with the confusion matrices as follows:
Confusion Matrix Exercise 1
Confusion Matrix Exercise 2
Confusion Matrix Exercise 3
Confusion Matrix Exercise 4
Confusion Matrix Exercise 5
Calculate the accuracy, precision, recall, sensitivity and F1 score from the confusion matrix in the following examples. The solutions will be given at the end of the article.
Confusion Matrix Evaluation Metrics - Exercise 1
We can calculate the evaluation metrics from the confusion matrices solutions given above.
- Accuracy 13/20 = 65%
- Precision 8/12 or 66.7%
- Recall (& sensitivity) 8/11 or 72.2%
- F1 score 2*(0.48/1.39), 0.70 or 70.0%
Confusion Matrix Evaluation Metrics - Exercise 2
- Accuracy 97/100 = 97%
- Precision 3/5 or 60%
- Recall (& sensitivity) 3/4 or 75%
- F1 score 2*(0.45/1.35), 0.67 or 66.7%
Confusion Matrix Evaluation Metrics - Exercise 3
- Accuracy 80/100 = 80%
- Precision 45/60 or 75%
- Recall (& sensitivity) 45/50 or 90%
- F1 score 2*(0.68/1.65), 0.82 or 81.8%
Confusion Matrix Evaluation Metrics - Exercise 4
- Accuracy 97/128 = 75.8%
- Precision 66/75 or 88%
- Recall (& sensitivity) 66/88 or 75%
- F1 score 2*(0.66/1.63), 0.81 or 81.0%
Confusion Matrix Evaluation Metrics - Exercise 5
- Accuracy 193/200 = 96.5%
- Precision 120/122 or 98.4%
- Recall (& sensitivity) 120/125 or 96%
- F1 score 2*(0.94/1.94), 0.97 or 97.2%